★
Trade Filings
Managers Stocks Filings Superinvestors
Signals Institutional Buying Institutional Selling Insider Activity 13D & 13G Watch Sector Rotation
Tools Stock Screener Manager Screener Compare Managers Consensus Baskets All Research Tools Data API
Learn & AI Learn Ask the Data AI Agents
News ★ Saved
About About us Methodology Contact Disclaimer
Reader
DATA PLANS

Historical data downloads: coming with accounts.

API GATEWAY

Free read-only JSON access to the site's cached data.

Dark mode

Guided View
New to markets (prices, yields, YTD, market cap)? We explain every term as you browse, in plain English. Same data, with the help built in.

Expert View
You already know the market. Just the data: clean, fast and compact, with no extra explanations. This is the default view.

Interface language
Engraved harvest field, rows of bound sheaves being tallied beside a cart

The Filing Season

Every 13F report from every filer: cover-page totals for the whole season, what got accumulated and reduced, who changed, and the amendments record.

Q3 2026 Q2 2026 Q1 2026 Q4 2025 Q3 2025 Q2 2025
8,56813F-HR reports
$60.40TΣ reported value
4.03MHoldings listedall filers · Q2 2025
265Amendments
1,837Notice filings
Jul 01First filed
Oct 27Latest filed

Σ value = cover-page totals as reported, across 8,568 of 8,568 reports parsed so far · a 13F-NT is a notice that the manager's positions appear on another filer's report (combined reporting)

8,568 reports filed Jul 01 to May 29; busiest day Aug 14 with 1,7514909801,4701,961Jul 01: 18 reportsJul 02: 21 reportsJul 03: 19 reportsJul 07: 93 reportsJul 08: 123 reportsJul 09: 167 reportsJul 10: 132 reportsJul 11: 136 reportsJul 14: 132 reportsJul 15: 203 reportsJul 16: 182 reportsJul 17: 221 reportsJul 18: 149 reportsJul 21: 184 reportsJul 22: 207 reportsJul 23: 222 reportsJul 24: 167 reportsJul 25: 171 reportsJul 28: 140 reportsJul 29: 223 reportsJul 30: 197 reportsJul 31: 205 reportsAug 01: 258 reportsAug 04: 161 reportsAug 05: 252 reportsAug 06: 246 reportsAug 07: 270 reportsAug 08: 294 reportsAug 11: 345 reportsAug 12: 532 reportsAug 13: 736 reportsAug 14: 1,751 reportsAug 15: 125 reportsAug 18: 34 reportsAug 19: 21 reportsAug 20: 8 reportsAug 21: 8 reportsAug 22: 5 reportsAug 25: 4 reportsAug 26: 8 reportsAug 27: 27 reportsAug 28: 16 reportsAug 29: 7 reportsSep 02: 20 reportsSep 03: 4 reportsSep 04: 8 reportsSep 05: 7 reportsSep 08: 5 reportsSep 09: 8 reportsSep 10: 1 reportsSep 11: 2 reportsSep 15: 2 reportsSep 19: 5 reportsSep 22: 5 reportsSep 23: 3 reportsSep 24: 21 reportsSep 25: 21 reportsSep 26: 1 reportsSep 29: 4 reportsSep 30: 6 reportsMar 02: 1 reportsMar 06: 1 reportsMar 09: 1 reportsMar 12: 2 reportsMar 17: 1 reportsMar 24: 2 reportsMar 26: 1 reportsApr 14: 1 reportsApr 17: 1 reportsApr 20: 1 reportsApr 22: 1 reportsApr 24: 1 reportsMay 12: 1 reportsMay 15: 3 reportsMay 19: 1 reportsMay 20: 1 reportsMay 21: 1 reportsMay 28: 1 reportsMay 29: 3 reports100%45-day deadline · Aug 141,751 on Aug 14Jul 1Jul 15Aug 1Aug 15Sep 1Sep 15Oct 1Oct 15Nov 1Nov 15Dec 1Dec 15Jan 1Jan 15Feb 1Feb 15Mar 1Mar 15Apr 1Apr 15May 1May 15
13F-HR reports filed per day, all filers, with the 45-day statutory deadline marked. Bars are calendar days (weekends stay empty); the line traces the cumulative share of the season filed.
50.6% of reports arrived in the final week before the Aug 14 deadline
What the tracked universe did this season
+6,575New positions
−5,785Full exits
22,847Increased
18,406Reduced
53Comparable managers

Position-level changes across tracked managers with a comparable prior filing (the deep-parsed universe, not all filers). Buying in depth → · Selling in depth →
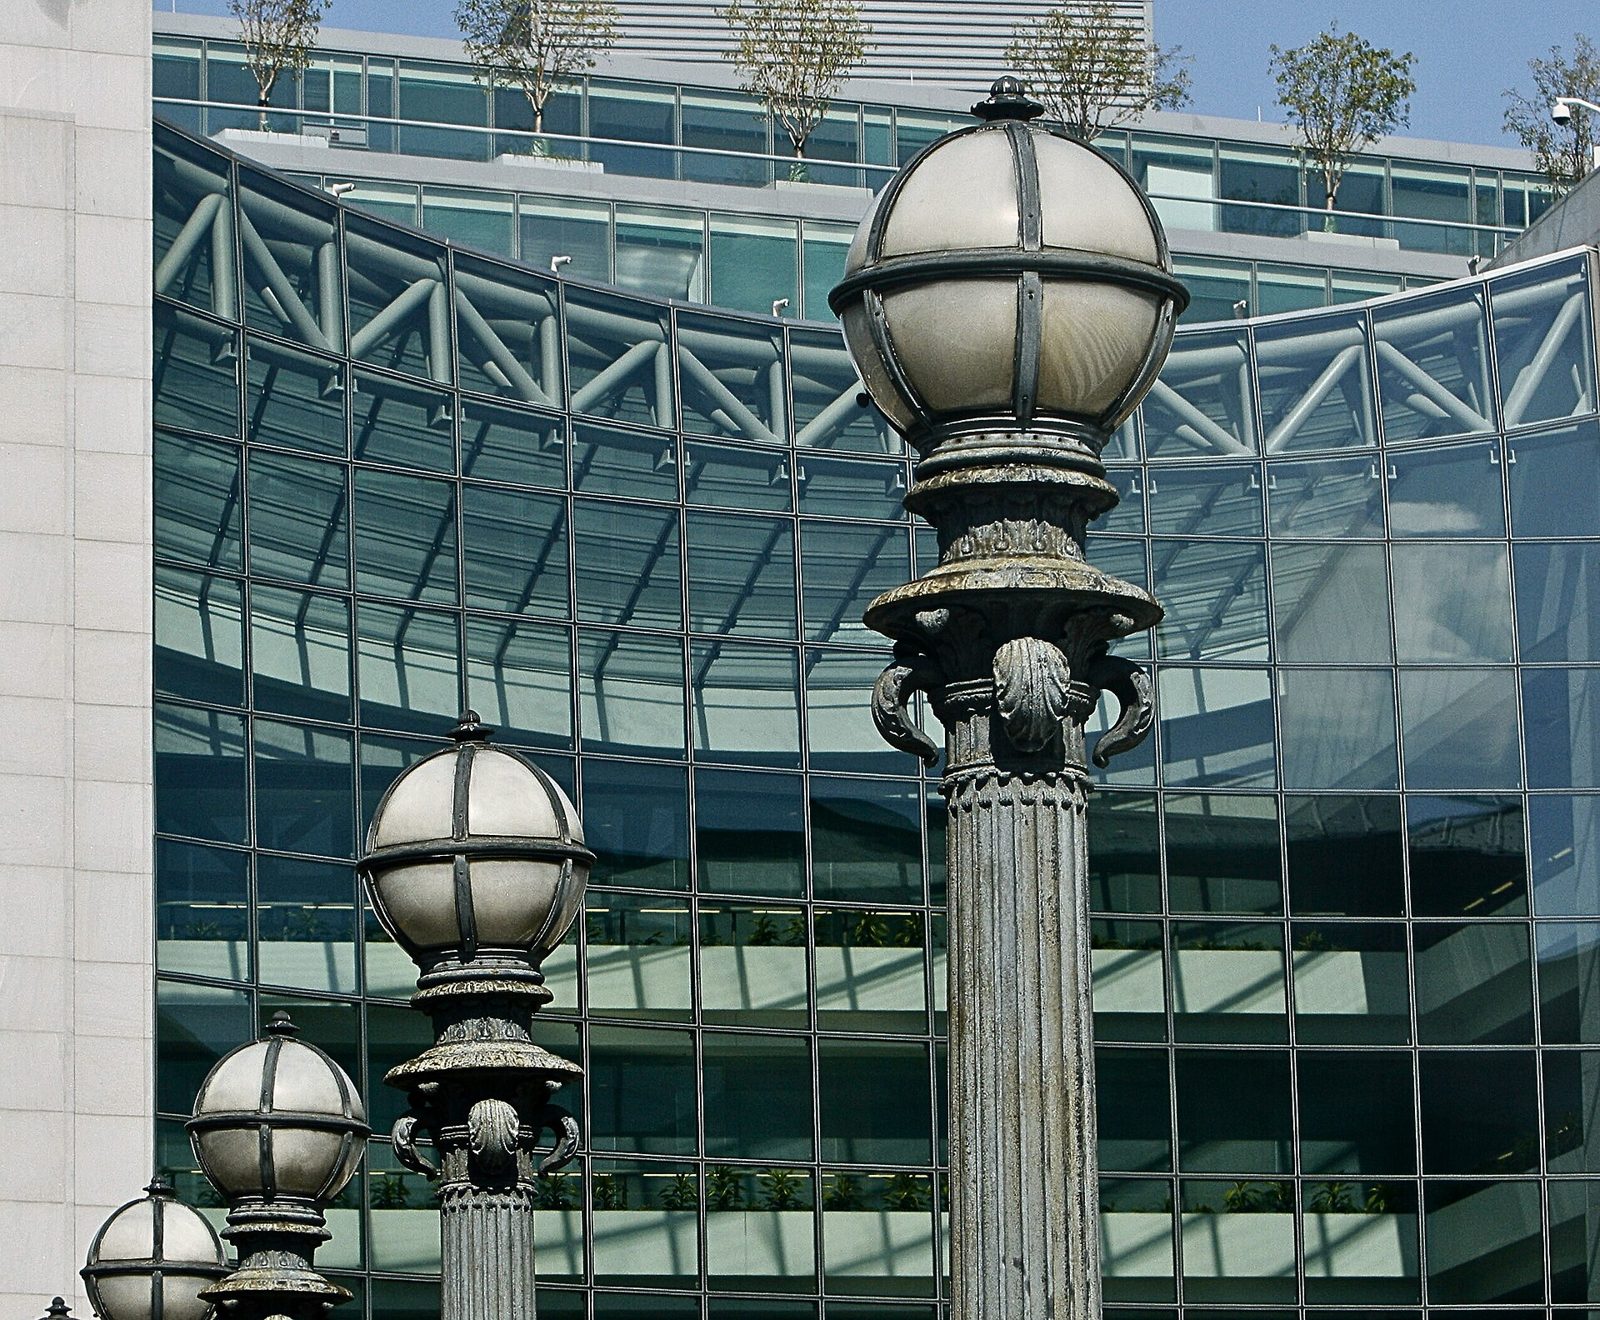
Street lamps in front of the glass facade of the SEC headquarters
Headquarters of the U.S. Securities and Exchange Commission, Washington, D.C., 2008. Photo: David (dbking on Flickr) · CC BY 2.0 · Wikimedia Commons · All photo credits
Most accumulated · most reduced

Most accumulated so far

SecurityΔ holdersNewHolders
RAL Ralliant Corp +17 +17 20
CRCL Circle Internet… +16 +16 19
ETOR eToro Group Ltd. +15 +15 17
B Barrick Mining… +15 +15 18
CHYM Chime Financial… +14 +14 17
RKLB Rocket Lab USA, Inc. +14 +14 17
CIB Grupo Cibest S.A. +13 +13 16
CAI Caris Life… +13 +13 16

Most reduced so far

SecurityΔ holdersExitsHolders
ALKT Alkami Technology… -6 −6 11
JD JD.com, Inc. -5 −6 17
VSTS Vestis Corporation -5 −6 14
RYAN Ryan Specialty… -5 −5 14
MZTI The Marzetti Company -5 −5 13
DECK Deckers Outdoor… -5 −5 17
IIIV i3 Verticals, Inc. -5 −5 9
HAIN -5 −5 12

Tracked universe, comparable-manager sets.

Largest reported portfolios this season
#ManagerReported valuePositionsFiled
1 The Vanguard Group $6.18T 16,643 Aug 11
2 BlackRock $5.25T 49,987 Aug 12
3 State Street Global Advisors $2.67T 4,260 Aug 14
4 Fidelity (FMR) $1.77T 13,187 Aug 14
5 Morgan Stanley $1.54T 44,865 Aug 14
6 JPMorgan Chase $1.53T 31,400 Aug 12
7 Geode Capital Management $1.43T 8,497 Aug 08
8 Bank Of America Corp /De/ $1.37T 28,404 Aug 14
9 Norges Bank $801.15B 1,707 Aug 13
10 Goldman Sachs Group $736.09B 13,021 Aug 14
11 Northern Trust Corp $727.16B 20,680 Aug 13
12 Susquehanna International Group, Llp $719.81B 14,120 Aug 14
Notable manager changes
01 Coatue Management

Reported value +58.3% QoQ ($22.68B → $35.90B)

→
02 Gotham Asset Management

Reported value +39.5% QoQ ($11.98B → $16.71B)

→
03 Altimeter Capital

Reported value +39.4% QoQ ($4.97B → $6.93B)

→
04 ARK Investment Management

Reported value +36.5% QoQ ($9.99B → $13.64B)

→
05 Citadel Advisors

+1193 new positions this quarter (15,124 total)

→
06 Marshall Wace

+692 new positions this quarter (5,574 total)

→
07 Renaissance Technologies

+594 new positions this quarter (3,522 total)

→
08 Two Sigma Investments

+489 new positions this quarter (3,150 total)

→
09 Point72 Asset Management

Top-10 concentration 12% → 17% (+4.4pp)

→
10 Bridgewater Associates

Top-10 concentration 32% → 36% (+4.3pp)

→

Screened from tracked managers with comparable prior filings: largest reported-value swings (≥$500M books), most new positions, and biggest concentration jumps. Value changes mix trading and market moves.

The amendments record
ManagerTypeOriginal filedAmendedValue: original → amended
Neuberger Berman Group LLC restatement Aug 13 Oct 27 $129.87B → $130.01B (+0.1%) SEC ↗
Elm Partners Management LLC restatement Aug 05 Oct 07 $1.72B → $2.14B (+24.4%) SEC ↗
Advus Financial Partners, LLC restatement n/a Oct 02 totals pending parse SEC ↗
OP Asset Management Ltd restatement Apr 20 Sep 18 $6.97B → $6.79B (-2.6%) SEC ↗
Boston Research & Management Inc new holdings Aug 12 Sep 04 $418,373 → $423.31M (+101079.3%) SEC ↗
Redwood Investment Management, LLC restatement Aug 14 Aug 26 $943,212 → $943,212 (0.0%) SEC ↗
Whitebox Advisors Llc new holdings Aug 14 Aug 26 $4.71B → $188.95M (-96.0%) SEC ↗
Advisors Asset Management, Inc. restatement Aug 12 Aug 24 $5.59B → $5.59B (0.0%) SEC ↗
Advisors Asset Management, Inc. new holdings Aug 12 Aug 21 $5.59B → $60,725 (-100.0%) SEC ↗
Hbk Investments L P new holdings Aug 13 Aug 14 $4.72B → $2.94B (-37.6%) SEC ↗
Militia Capital Partners, LP new holdings Aug 14 Aug 14 $214.61M → $432.71M (+101.6%) SEC ↗
Oxford Asset Management Llp new holdings Aug 14 Aug 14 $276.48M → $3.08M (-98.9%) SEC ↗
Oddo Bhf Asset Management Sas new holdings Aug 14 Aug 14 $2.54B → $89.64M (-96.5%) SEC ↗
OCONNOR, A Distinct Business Unit… new holdings Aug 14 Aug 14 $1.95B → $90.45M (-95.4%) SEC ↗
Torno Capital, Llc new holdings Aug 14 Aug 14 $547.33M → $949.67M (+73.5%) SEC ↗

“restates entire filing” replaces the original table; “new holding entries” adds to it. Our analytics always use the latest accepted version; both filings stay in the record. How amendments work

The complete feed

Showing 4,601–4,700 of 9,941 managers that reported this season
One row per manager: these managers filed 10,670 separate documents; advisers may file one 13F per sub-portfolio. A further 262 superseded versions are excluded. Totals combine only live documents.

Aug 12 Hellman & Friedman Investors VIII, L.P.

value not stated on cover page · SEC ↗

Q2 2025
Aug 12 Stichting Pensioenfonds Abp

value not stated on cover page · SEC ↗

Q2 2025
Aug 12 Baring SICE (Taiwan) LTD

value not stated on cover page · SEC ↗

Q2 2025
Aug 12 Edmond De Rothschild (Monaco)

value not stated on cover page · SEC ↗

Q2 2025
Aug 12 FIDUCIARY TRUST Co OF CANADA

value not stated on cover page · SEC ↗

Q2 2025
Aug 12 BlackRock Asset Management Deutschland AG

value not stated on cover page · SEC ↗

Q2 2025
Aug 12 Raymond James Trust N.A.

value not stated on cover page · SEC ↗

Q2 2025
Aug 12 Royal Bank of Canada (Channel Islands) Ltd

value not stated on cover page · SEC ↗

Q2 2025
Aug 12 BlackRock Institutional Trust Company, N.A.

value not stated on cover page · SEC ↗

Q2 2025
Aug 12 Regents Park Funds, LLC

value not stated on cover page · SEC ↗

Q2 2025
Aug 12 Blackrock Advisors Llc

value not stated on cover page · SEC ↗

Q2 2025
Aug 12 Blackrock Financial Management Inc/De

value not stated on cover page · SEC ↗

Q2 2025
Aug 12 Symetra Financial CORP

value not stated on cover page · SEC ↗

Q2 2025
Aug 12 BlackRock Japan Co. Ltd

value not stated on cover page · SEC ↗

Q2 2025
Aug 12 Castle Creek Capital VI LLC

value not stated on cover page · SEC ↗

Q2 2025
Aug 12 Edmond De Rothschild Asset Management (Luxembourg)

value not stated on cover page · SEC ↗

Q2 2025
Aug 12 55I, Llc

value not stated on cover page · SEC ↗

Q2 2025
Aug 12 Middlefield Ventures, Inc.

value not stated on cover page · SEC ↗

Q2 2025
Aug 12 Bancreek Capital Advisors, LLC

value not stated on cover page · SEC ↗

Q2 2025
Aug 12 Prudential Gibraltar Financial Life Insurance Co.…

value not stated on cover page · SEC ↗

Q2 2025
Aug 12 RBC Dominion Securities Global Ltd

value not stated on cover page · SEC ↗

Q2 2025
Aug 12 LGIM Singapore PTE Ltd

value not stated on cover page · SEC ↗

Q2 2025
Aug 12 XTX Holdings LLC

value not stated on cover page · SEC ↗

Q2 2025
Aug 12 RBC Capital Markets, LLC

value not stated on cover page · SEC ↗

Q2 2025
Aug 12 Dnb Fund

value not stated on cover page · SEC ↗

Q2 2025
Aug 12 DWS Investments Hong Kong Ltd

value not stated on cover page · SEC ↗

Q2 2025
Aug 12 BlackRock Fund Managers Ltd.

value not stated on cover page · SEC ↗

Q2 2025
Aug 12 BlackRock Investment Management (UK) Ltd.

value not stated on cover page · SEC ↗

Q2 2025
Aug 12 BlackRock (Netherlands) B.V.

value not stated on cover page · SEC ↗

Q2 2025
Aug 12 J.P. Morgan (Suisse) SA

value not stated on cover page · SEC ↗

Q2 2025
Aug 12 JPMorgan Asset Management (Asia Pacific) Ltd

value not stated on cover page · SEC ↗

Q2 2025
Aug 12 JPMorgan Asset Management (Taiwan) Ltd

value not stated on cover page · SEC ↗

Q2 2025
Aug 12 ClariVest Asset Management LLC

value not stated on cover page · SEC ↗

Q2 2025
Aug 12 J.P. Morgan Trust Co of Delaware

value not stated on cover page · SEC ↗

Q2 2025
Aug 12 BlackRock Asset Management Schweiz AG

value not stated on cover page · SEC ↗

Q2 2025
Aug 12 Oxford Wealth Group, LLC

value not stated on cover page · SEC ↗

Q2 2025
Aug 12 Edmond De Rothschild (Suisse) S.A.

value not stated on cover page · SEC ↗

Q2 2025
Aug 12 Edmond De Rothschild Asset Management (France)

value not stated on cover page · SEC ↗

Q2 2025
Aug 12 Xtx Markets Llc

value not stated on cover page · SEC ↗

Q2 2025
Aug 12 Eisler Capital (MT) Ltd

value not stated on cover page · SEC ↗

Q2 2025
Aug 11 The Vanguard Group

$6.18T reported · 16,643 holdings listed · 6 other managers included · largest holding: NVDA · analysis · SEC ↗

Q2 2025
Aug 11 Citigroup Inc

$203.59B reported · 15,854 holdings listed · 12 other managers included · analysis · SEC ↗

Q2 2025
Aug 11 PRIMECAP Management

$126.19B reported · 333 holdings listed · largest holding: LLY · +12 new · −13 exits · analysis · SEC ↗

Q2 2025
Aug 11 HighTower Advisors, LLC

$79.83B reported · 3,752 holdings listed · analysis · SEC ↗

Q2 2025
Aug 11 Universal- Beteiligungs- und Servicegesellschaft mbH

$56.53B reported · 2,009 holdings listed · 4 other managers included · analysis · SEC ↗

Q2 2025
Aug 11 Nomura Asset Management Co Ltd

$36.47B reported · 2,318 holdings listed · 5 other managers included · analysis · SEC ↗

Q2 2025
Aug 11 Private Advisor Group, LLC

$18.57B reported · 2,510 holdings listed · SEC ↗

Q2 2025
Aug 11 Wealthspire Advisors, LLC

$17.80B reported · 971 holdings listed · SEC ↗

Q2 2025
Aug 11 Alps Advisors Inc

$17.34B reported · 1,070 holdings listed · 3 other managers included · SEC ↗

Q2 2025
Aug 11 Brown Brothers Harriman & Co

$15.55B reported · 1,547 holdings listed · SEC ↗

Q2 2025
Aug 11 TD Waterhouse Canada Inc.

$13.96B reported · 1,992 holdings listed · 1 other managers included · analysis · SEC ↗

Q2 2025
Aug 11 United Capital Financial Advisors, Llc

$12.40B reported · 1,098 holdings listed · 1 other managers included · SEC ↗

Q2 2025
Aug 11 Aptus Capital Advisors, LLC

$12.27B reported · 1,751 holdings listed · 1 other managers included · SEC ↗

Q2 2025
Aug 11 Great Lakes Advisors, Llc

$11.93B reported · 1,629 holdings listed · SEC ↗

Q2 2025
Aug 11 B. Metzler seel. Sohn & Co. AG

$10.46B reported · 1,146 holdings listed · 1 other managers included · SEC ↗

Q2 2025
Aug 11 Amova Asset Management Americas, Inc.

$10.03B reported · 190 holdings listed · 2 other managers included · SEC ↗

Q2 2025
Aug 11 Royce & Associates Lp

$9.74B reported · 782 holdings listed · SEC ↗

Q2 2025
Aug 11 Madison Asset Management, LLC

$9.26B reported · 338 holdings listed · SEC ↗

Q2 2025
Aug 11 Empowered Funds, LLC

$8.83B reported · 4,275 holdings listed · 24 other managers included · SEC ↗

Q2 2025
Aug 11 Longview Asset Management, Llc

$8.61B reported · 3 holdings listed · SEC ↗

Q2 2025
Aug 11 Duff & Phelps Investment Management Co

$8.51B reported · 154 holdings listed · 2 other managers included · SEC ↗

Q2 2025
Aug 11 Artemis Investment Management LLP

$7.81B reported · 192 holdings listed · SEC ↗

Q2 2025
Aug 11 Raiffeisen Bank International AG

$6.74B reported · 756 holdings listed · 6 other managers included · SEC ↗

Q2 2025
Aug 11 NewEdge Wealth, LLC

$6.38B reported · 964 holdings listed · SEC ↗

Q2 2025
Aug 11 Renaissancere Holdings Ltd 17 reports combined

$6.12B reported · 107 holdings listed · 49 other managers included · SEC ↗

Jul 11–Aug 11
Aug 11 Principal Securities, Inc.

$5.32B reported · 3,679 holdings listed · SEC ↗

Q2 2025
Aug 11 Reaves W H & Co Inc

$4.51B reported · 97 holdings listed · 1 other managers included · SEC ↗

Q2 2025
Aug 11 Mill Creek Capital Advisors, LLC

$4.51B reported · 263 holdings listed · SEC ↗

Q2 2025
Aug 11 Kayne Anderson Capital Advisors Lp amended

$4.32B reported · 68 holdings listed · 1 other managers included · SEC ↗

Q2 2025
Aug 11 Martingale Asset Management L P

$4.08B reported · 1,127 holdings listed · 1 other managers included · SEC ↗

Q2 2025
Aug 11 Waratah Capital Advisors Ltd.

$3.76B reported · 155 holdings listed · SEC ↗

Q2 2025
Aug 11 Independent Advisor Alliance

$3.47B reported · 1,541 holdings listed · SEC ↗

Q2 2025
Aug 11 Avantax Planning Partners, Inc.

$3.15B reported · 447 holdings listed · SEC ↗

Q2 2025
Aug 11 Marathon Asset Management Ltd

$3.12B reported · 79 holdings listed · SEC ↗

Q2 2025
Aug 11 Senvest Management, LLC

$2.99B reported · 53 holdings listed · SEC ↗

Q2 2025
Aug 11 FineMark National Bank & Trust

$2.94B reported · 523 holdings listed · SEC ↗

Q2 2025
Aug 11 One Capital Management, LLC

$2.89B reported · 467 holdings listed · SEC ↗

Q2 2025
Aug 11 Renaissance Group Llc

$2.78B reported · 282 holdings listed · SEC ↗

Q2 2025
Aug 11 Krane Funds Advisors LLC

$2.54B reported · 138 holdings listed · SEC ↗

Q2 2025
Aug 11 Banque Cantonale Vaudoise

$2.45B reported · 895 holdings listed · SEC ↗

Q2 2025
Aug 11 Seizert Capital Partners, Llc

$2.28B reported · 172 holdings listed · SEC ↗

Q2 2025
Aug 11 New Age Alpha Advisors, LLC

$2.27B reported · 830 holdings listed · SEC ↗

Q2 2025
Aug 11 CBIZ Investment Advisory Services, LLC

$2.26B reported · 742 holdings listed · SEC ↗

Q2 2025
Aug 11 Black Creek Investment Management Inc.

$2.16B reported · 26 holdings listed · SEC ↗

Q2 2025
Aug 11 Sprott Inc.

$2.11B reported · 208 holdings listed · SEC ↗

Q2 2025
Aug 11 Heritage Wealth Advisors

$2.11B reported · 590 holdings listed · SEC ↗

Q2 2025
Aug 11 Trajan Wealth LLC

$2.04B reported · 143 holdings listed · SEC ↗

Q2 2025
Aug 11 Empirical Finance, LLC

$1.91B reported · 508 holdings listed · SEC ↗

Q2 2025
Aug 11 Dorsey & Whitney Trust CO LLC

$1.89B reported · 4,349 holdings listed · 58 other managers included · SEC ↗

Q2 2025
Aug 11 Rice Hall James & Associates, Llc

$1.86B reported · 247 holdings listed · SEC ↗

Q2 2025
Aug 11 Lowe Brockenbrough & Co Inc

$1.78B reported · 314 holdings listed · SEC ↗

Q2 2025
Aug 11 Angeles Investment Advisors, LLC

$1.77B reported · 31 holdings listed · SEC ↗

Q2 2025
Aug 11 Western Wealth Management, LLC

$1.69B reported · 723 holdings listed · SEC ↗

Q2 2025
Aug 11 Sofi Wealth, Llc

$1.64B reported · 46 holdings listed · SEC ↗

Q2 2025
Aug 11 Rothschild Investment Llc

$1.60B reported · 3,016 holdings listed · SEC ↗

Q2 2025
Aug 11 Wilkinson Global Asset Management LLC

$1.59B reported · 106 holdings listed · SEC ↗

Q2 2025
Aug 11 Bank of Finland

$1.53B reported · 4 holdings listed · SEC ↗

Q2 2025
Aug 11 Westpac Banking Corp

$1.50B reported · 805 holdings listed · 2 other managers included · SEC ↗

Q2 2025
Aug 11 Frank, Rimerman Advisors LLC

$1.49B reported · 561 holdings listed · SEC ↗

Q2 2025
Aug 11 Nations Financial Group Inc, /Ia/ /Adv

$1.45B reported · 678 holdings listed · SEC ↗

Q2 2025
← Previous Page 47 / 100 Next →
Provenance: Filing index from EDGAR quarterly form indexes; per-filing totals parsed from each filing's own cover/summary page (values as reported; a small number of filers mistakenly report in $thousands); position-level changes from parsed information tables (tracked universe, comparable sets). Every row links to its original SEC document. Data pipeline methodology